SurfProtect Latency - Redux
Not so long ago, we posted an article that detailed an issue impacting SurfProtect service stability. We described our investigation into the cause of the problem and celebrated its resolution.
This week, it came back.
While our previous investigation required significant effort, co-ordination between our teams, and time, we're happy to say that the lessons learned from our previous difficulties meant that we were able to diagnose the issue and apply a fix within hours. The problem again proved to be service-affecting, however, and this follow-up describes once again what happened, providing more insight into how we run our services and hopefully explaining why we don't expect another repeat.
The issue impacted two servers almost simultaneously, just after 08:00 in the morning on Thursday 2022-11-10. We've had weeks of monitoring to confirm that cpu usage was back to normal levels so we were confident in the findings from our previous investigation but we're now unsure whether we fixed a similar issue or simply relieved pressure on the current one. We will likely continue this series of articles with a discussion of the work required to confirm our current belief.
Traffic was migrated away from the affected servers to an available machine and after some time we started to see the problem starting to occur on that server too. Fortunately, a potential fix was available before it was necessary to migrate traffic away and we were able to observe an immediate change in behaviour with the fix applied.
Restarting the investigation
Just like in the previous incidents, the first we knew that anything was wrong was when our monitoring system started alerting us to high service latency on two servers.
Our team was ready to respond and immediately started up our data collection script on the affected machines then looked up performance metrics while we waited for the more detailed traces to populate.
Running top showed just over 50% cpu usage, and confirmed that, yet again, nearly all of our time was spent servicing system calls. As expected, all of the load was on the cores that we bind the proxy software to.
The graphical data shows a rapid but not quite immediate ramp up to those levels:
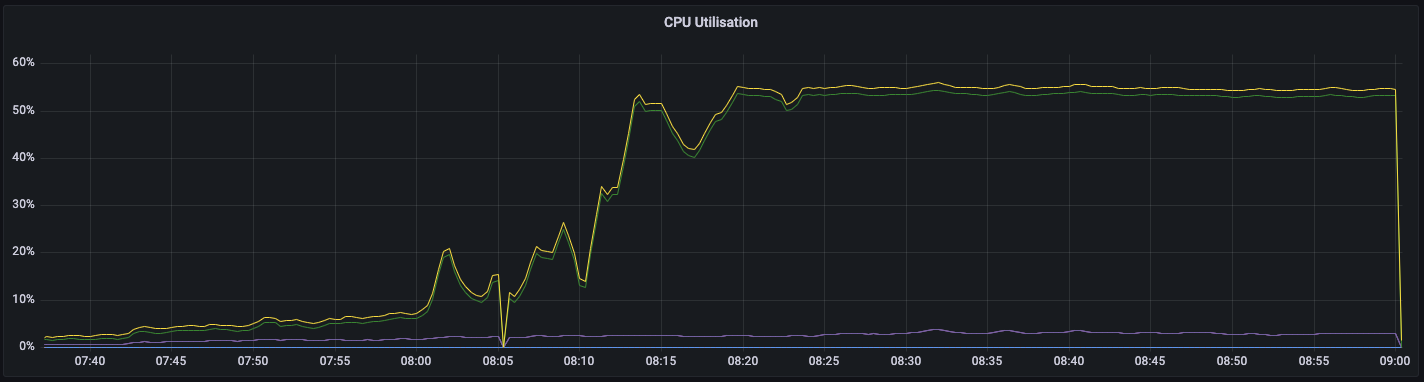
It might seem strange that we're apparently hitting full capacity at only ~50% cpu usage but that's plenty to handle the current traffic volume we're allocating to each machine, and we're avoiding running the proxy process across NUMA domains for now. Just like before, nearly all of our cpu time was spent in system calls and was concentrated onto the cores running the proxy.
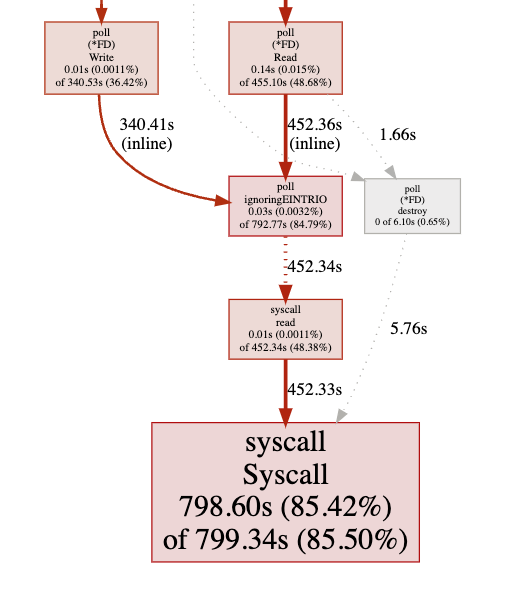
We've included a visualisation of where the proxy was spending its time again, but the values are so close to the previous post that we may as well have just duplicated the image:
This time, though, let's look at the actual impact of that high load. This image shows the latency that our health checker observed while monitoring one proxy service.
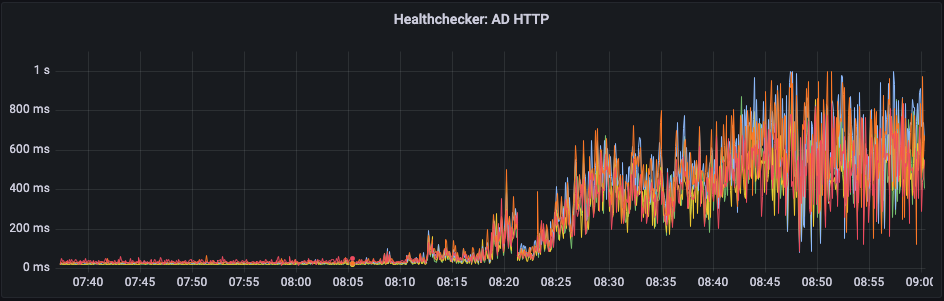
See how inconsistent those latencies are? That's a measure of how irregular system call latencies were, which fits with the idea that we're blocking while waiting for a (very) contended resource.
Even at the extreme lower end of the graph, latency looks horrendous when compared to the values we expect to see.

The spikes here on metrics gathered under normal load measure increased latency on the services we're accessing through the proxy rather than on the proxy itself, and it's clear to see that the earlier samples were severly impacted by the issue. At up to 1 second to handle a web request, users are going to find the service unbearably slow.
Measuring contention
So far we've limited our discussion to directly measuring the impact of the problem to the overall service, but what about individual components? Do some parts of the proxy fare better than others under contention and can we use that knowledge to make the service more resilient to the problem?
One of the metrics we track shows the average time taken to successfully complete TLS handshakes. The amount of work done by both sides is dependent on a few factors so it's normal for us to have quite a wide spread of latencies under normal load. Clearly, though, the increase in time taken by this subsystem will contribute to the overall drop in performance.

Other than highlighting that we need to add more bins to that particular histogram, this data shows that we're starting to add a great deal of latency before we even receive a web request.
On the other end the proxy's duties, we find that latency starts piling up further as response times from our backend decision logic appear to increase significantly.
We use two types of request messages for interacting with the backend service: options requests and decision requests. Decision requests determine the exact behaviour of the service in response to the web request made by a user and their latency exhibits a somewhat long tail as we sometimes need to consult services that sit elsewhere on the network. Options requests, on the other hand, control proxy behaviour during initial interception of web requests, and are usually expected to return a response within well under a millisecond.


We didn't anticipate that it would be useful to measure more that 500x the expected response time of an options request but it's safe to use the metrics for decision requests as a guide and assume that both sets of communication are adding on average 100-200ms or higher to our total time.
That sounds really bad but the deciders themselves paint a different picture. This is higher resolution breakdown of the time taken to process the same requests we measured above, this time from the point of view of one of the local decider processes

The deciders are assigned to completely different cores than the proxy instance but it's clear that performance is still impacted by what's happening on the rest of the machine. While the proxy measures hundreds of milliseconds of latency, however, here we see that requests are now most likely to be processed in 100us to 2ms, and that no request takes more that 10ms.
While there's definitely evidence of degraded performance across the machine, we have once again found that the issue impacts us most greatly in communication between services.
Jumping to the root cause
During our earlier investigation, the team initially focused on debugging our own services and eventually we started building tools to investigate the possibility of an issue within the Linux kernel. With those tools now having been rolled into our data collection process, all the data we needed was ready by the time we'd performed our initial analysis and determined that the symptoms exactly matched the issues we'd only just fixed.
We knew exactly what the contention looked like before and went straight to our flame graph to see if we could see any sign of similar behaviour:

Unbelievably, the flame graph was almost indistinguishable from the version we published last time. All of our cpu time is being spent acquiring a lock to perform htab_map_update_elem.
With that in mind, we recalled from our previous analysis that we'd initially worried about potentially measuring behaviour of the tracer, based on seeing contended calls to same locking mechanism that appeared heavily in calls to apparmor_socket_sendmsg. We put those instances down to backpressure from the actual issue since they went away after disabling AppArmour but here they were again!
This gave credibility to the idea that there were perhaps multiple sources of contention, and removing AppArmor had merely reduced demand on our contented resource enough that the issue was no longer visible.
Turning to the stack traces we'd just gathered, we quickly recognised that the calls we'd erroneously attributed to our use of ftrace appear in fact to have been caused by actively registered kernel probes.
The trampoline handler shown below is responsible for calling a user-specified return handler that we can spending a lot of time in a spin lock:
   7)               |        trampoline_handler() {
   7)   0.201 us    |          kprobe_busy_begin();
   7)               |          kretprobe_hash_lock() {
   7)   0.201 us    |            _raw_spin_lock_irqsave();
   7)   0.561 us    |          }
   7)   0.200 us    |          percpu_array_map_lookup_elem();
   7)   0.200 us    |          percpu_array_map_lookup_elem();
   7)   0.201 us    |          bpf_get_current_pid_tgid();
   7)               |          __htab_map_lookup_elem() {
   7)   0.211 us    |            lookup_nulls_elem_raw();
   7)   0.761 us    |          }
   7)               |          htab_map_update_elem() {
   7)               |            _raw_spin_lock_irqsave() {
   7) # 1059.700 us |              native_queued_spin_lock_slowpath();
   7) # 1060.732 us |            }
   7)   0.421 us    |            lookup_elem_raw();
   7)               |            alloc_htab_elem() {
   7)               |              __pcpu_freelist_pop() {
   7)   0.201 us    |                _raw_spin_lock();
   7)   0.190 us    |                _raw_spin_lock();
   7)   0.201 us    |                _raw_spin_lock();
   7)   0.191 us    |                _raw_spin_lock();
   7)   0.200 us    |                _raw_spin_lock();
   7)   0.190 us    |                _raw_spin_lock();
   7)   0.190 us    |                _raw_spin_lock();
   7)   0.191 us    |                _raw_spin_lock();
   7)   0.190 us    |                _raw_spin_lock();
   7)   0.190 us    |                _raw_spin_lock();
   7)   0.190 us    |                _raw_spin_lock();
   7)   0.190 us    |                _raw_spin_lock();
...
Now we're getting somewhere. If we have a service on the servers that's registering a handler for events that we're generating frequently then it's quite plausible it could be inadvertantly causing the problem.
Hunting for probes
Attempting to identify the functions that were being probed, we discovered an intesting set of tracepoints enabled on all of our proxy servers:
# cat /sys/kernel/debug/tracing/set_event
irq_vectors:thermal_apic_exit
irq_vectors:thermal_apic_entry
irq_vectors:deferred_error_apic_exit
irq_vectors:deferred_error_apic_entry
irq_vectors:threshold_apic_exit
irq_vectors:threshold_apic_entry
irq_vectors:call_function_single_exit
irq_vectors:call_function_single_entry
irq_vectors:call_function_exit
irq_vectors:call_function_entry
irq_vectors:reschedule_exit
irq_vectors:reschedule_entry
irq_vectors:irq_work_exit
irq_vectors:irq_work_entry
irq_vectors:x86_platform_ipi_exit
irq_vectors:x86_platform_ipi_entry
irq_vectors:error_apic_exit
irq_vectors:error_apic_entry
irq_vectors:spurious_apic_exit
irq_vectors:spurious_apic_entry
irq_vectors:local_timer_exit
irq_vectors:local_timer_entry
irq:softirq_exit
irq:softirq_entry
irq:irq_handler_exit
irq:irq_handler_entry
sched:sched_process_exec
sched:sched_process_fork
sched:sched_process_exit
oom:mark_victim
This is far from an exhaustive list of the tracepoints exported by the kernel but many of the events listed occur very often.
Assuming from patterns observed in our stack trace that there were also dynamically created probes in play, we quickly came up with a plan to disable them on the machine exhibiting signs of the issue to see if we could alter its behaviour. Once again, the interface for achieving this could barely have been simpler:
echo 0 > /sys/kernel/debug/kprobes/enabled
echo > /sys/kernel/debug/tracing/set_event
As the issue had only just started to appear on the affected machine, there wasn't yet a great impact on cpu so the immediate response to this action was almost underwhelming. The data gathering script was run and we waited a minute until we had flame graph showing no sign of the problem.
We could almost have believed that the problem had simply dwindled away on its own but for one small detail: all references to kretprobe_ functions have now disappeared from the output.
Finding the root cause
Some time sat reasoning about what was going on served to highlight the likely cause of our kernel probes, as our engineers realised that tracepoints we'd identified were related to metrics that we gather on every machine with the excellent netdata tool. The default configuration makes use of EBPF programs to collect data and a little digging found evidence of probes to other functions that appeared to be particular hotspots in the traces we generated:
netdata_ebpf_targets_t socket_targets[] = { {.name = "inet_csk_accept", .mode = EBPF_LOAD_TRAMPOLINE},
                                            {.name = "tcp_retransmit_skb", .mode = EBPF_LOAD_TRAMPOLINE},
                                            {.name = "tcp_cleanup_rbuf", .mode = EBPF_LOAD_TRAMPOLINE},
                                            {.name = "tcp_close", .mode = EBPF_LOAD_TRAMPOLINE},
                                            {.name = "udp_recvmsg", .mode = EBPF_LOAD_TRAMPOLINE},
                                            {.name = "tcp_sendmsg", .mode = EBPF_LOAD_TRAMPOLINE},
                                            {.name = "udp_sendmsg", .mode = EBPF_LOAD_TRAMPOLINE},
                                            {.name = "tcp_v4_connect", .mode = EBPF_LOAD_TRAMPOLINE},
                                            {.name = "tcp_v6_connect", .mode = EBPF_LOAD_TRAMPOLINE},
                                            {.name = NULL, .mode = EBPF_LOAD_TRAMPOLINE}};
We've since verified on a test machine that we're able to disable the use of EBPF in netdata and there's no further sign of probes being hit.
No work has yet been carried out to profile the handlers we were using but our expectation is that at least one must be aquiring a lock that's shared among the 48 cores we allocate to the proxy process, and that's causing contention issues when faced with large volumes of network events.
We plan to report the issue and hope that we'll be able to return to recording the missing metrics as soon as possible.
Going forward
We now have a convincing explanation for the issue and a solution that's been tested to work in the wild, but we've been here before. How do we guarantee both that we've really fixed the issue and that there are no similar issues waiting to take over?
Our engineers have constructed a plan to continuously gather profiling data from each proxy server and generate alert events whenever we encounter the cpu spending large amounts of time acquiring locks, or instances of any kretprobe_ function. The initial plan was to build a service to do this ourselves but we're currently evaluating the Grafana Phlare project to see if it can help us to achieve that goal.
While this solution doesn't guarantee against the problem reoccuring, it'll give us far earlier warning than our current monitoring is able to achieve and provide us with easy access to the data we need to diagnose what's happening.
netdata response
Update (2022-11-15): upon reporting this information to the netdata team via discord, we learned that they were already working on a solution for the next stable release (we were using netdata v1.36.1).
netdata latest tests showed that they had improvements after they merged: https://github.com/netdata/netdata/pull/13397 https://github.com/netdata/netdata/pull/13530 https://github.com/netdata/netdata/pull/13624